Welcome! If you're new to data science or even programming in general, this guide is for you. We'll go step-by-step and clearly explain what we are doing, why it matters, and what results to expect. By the end, you will understand how to take raw, messy data and turn it into clean, well-structured information ready for analysis or machine learning.
What is Data Cleaning?
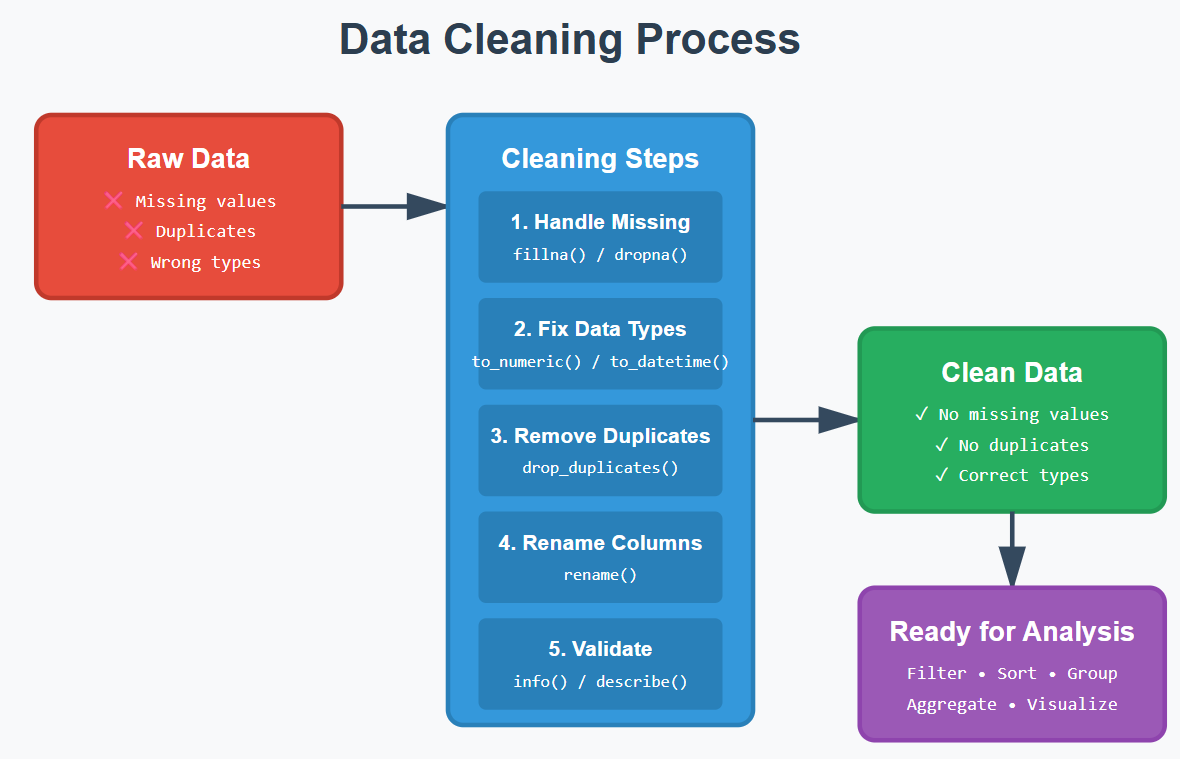
Data cleaning is the process of identifying and correcting (or removing) errors, inconsistencies, and inaccuracies in a dataset to improve its quality and reliability. Data cleaning ensures that your data is accurate, complete, and ready for analysis.
This essential step in data analysis prepares data for accurate decision-making and involves tasks like fixing errors, filling in missing values, and standardizing formats. In that way, you ensure your insights and models are based on solid ground and not biased information.
Why Data Cleaning and Manipulation Matter
Raw data is almost never usable as-is. It may contain:
- Missing values
- Wrong data types
- Duplicates
- Inconsistent formatting
- Irrelevant information
If you don't clean data properly:
- Your analysis becomes inaccurate
- Your models perform poorly
- Your conclusions become misleading
1. What is Pandas and Why Use It?
Pandas is a powerful Python library built specifically for data manipulation and analysis, developed on top of NumPy. It provides two main data structures — Series (one-dimensional) and DataFrame (two-dimensional) — that make it incredibly easy to work with structured data like spreadsheets or SQL tables.
With Pandas, you can quickly load data from various formats (CSV, Excel, SQL databases), clean and transform it, handle missing values, perform grouping and aggregation operations, and merge datasets together. It's become the go-to tool for data scientists and analysts because it combines the flexibility of Python with the intuitive feel of working with tabular data.
Why it is Important?
- Loads CSV, Excel, SQL, and more
- Cleans and restructures data efficiently
- Handles missing values gracefully
- Readable syntax
2. Setting Up Your Environment
To follow along, you only need Python installed. Install Pandas with:
pip install pandasPandas isn't built into Python — you need to install it once.
3. Understanding DataFrames
A DataFrame is like a digital spreadsheet:
- Rows = observations (e.g., each person, transaction, product)
- Columns = attributes (e.g., name, age, price)
- Index = row labels (usually numbers)
4. Importing Data
Example: Loading a CSV file
import pandas as pd

df = pd.read_csv('data.csv')
Pandas supports many formats like Excel, SQL, JSON, etc.
5. Inspecting & Understanding Data
Before cleaning any data, you must understand what you're dealing with.
Check dimensions and shape of dataset
df.shapeTells you how big the dataset is. Result: (rows, columns)
Check column names
df.columnsHelps you know what information you're working with, what columns are included.
Summary of data types & missing values
df.info()Identifies incorrectly typed data and which columns have missing values.
Statistical summary
df.describe()Gives insights into numeric columns: mean, median, min, and max. Quickly shows averages, standard deviations, etc.
6. Data Cleaning
This is the heart of data preparation.
6.1 Handling Missing Values
Missing values appear as NaN.
Identifying Missing Values:
df.isna().sum()You must know where problems are before fixing them.
Option 1: Remove incomplete rows
# Remove rows with any missing values
df = df.dropna()
Sometimes rows with missing data are unusable.
Option 2: Fill missing values — For numbers:
# Fill missing numeric values
df['age'] = df['age'].fillna(df['age'].mean())For text:
# Fill missing text values
df['city'] = df['city'].fillna('Unknown')
Makes text columns complete without guessing.
6.2 Fixing Data Types
Convert to Numeric:
df['age'] = pd.to_numeric(df['age'])You cannot do math on strings.
Convert to DateTime:
df['date'] = pd.to_datetime(df['date'])Enables sorting and time-based analysis.
6.3 Removing Duplicates
df = df.drop_duplicates()- Duplicates skew averages
- Create false patterns
6.4 Renaming Columns
df = df.rename(columns={'oldName': 'new_name'})- Makes column names easier to work with
- Improves readability
7. Data Manipulation Techniques
Now that the data is clean, let's analyze it.
Selecting Columns
Single column:
df['age']Multiple columns:
df[['name', 'city']]Filtering Rows
df[df['age'] > 25]Extract only relevant data.
Sorting Data
df.sort_values(by='age')Helps you see trends.
Creating New Columns
df['age_in_5_years'] = df['age'] + 5Adds insight or calculated fields.
Grouping & Aggregation
df.groupby('city')['sales'].sum()Summaries reveal patterns.
8. Mini Project: Cleaning & Analyzing a Dataset
Dataset: people.csv
name,age,city,income
Alice,25,New York,70000
Bob,,London,60000
Carol,22,,50000
Bob,,London,60000
Dave,35,Toronto,
We can observe the missing values in our dataset that need to be addressed for accurate analysis.
Step 1: Load
df = pd.read_csv('people.csv')Step 2: Inspect
df.info()
df.isna().sum()
Identify missing values and data types.
Step 3: Clean
Fill missing values:
df['age'] = df['age'].fillna(df['age'].mean())
df['city'] = df['city'].fillna('Unknown')
df['income'] = df['income'].fillna(df['income'].median())
Remove duplicates:
df = df.drop_duplicates()Step 4: Analyze
Total income by city:
df.groupby('city')['income'].sum()Average age:
df['age'].mean()
→ A fully cleaned dataset
→ Summary stats you can trust
→ Insights ready for reporting or modeling
Final Thoughts
You've now learned:
- Why data cleaning matters
- How to inspect, clean, and structure data
- How to manipulate and analyze a dataset
Found this useful? Connect with me on LinkedIn — I share more data science tutorials, tips and projects regularly.