Identifying Risk Drivers to Maximize Retention
A leading telecommunications provider was experiencing a steady increase in customer attrition, with a churn rate reaching 26.5%. Their existing "one-size-fits-all" retention approach was inefficient, often targeting customers who weren't planning to leave while missing those who were.
I was tasked with developing a machine learning pipeline to analyze 7,000+ customer profiles and identify the specific behavioral and contractual markers of churn. The goal was to move from reactive troubleshooting to a proactive, data-driven retention engine.
Business Impact
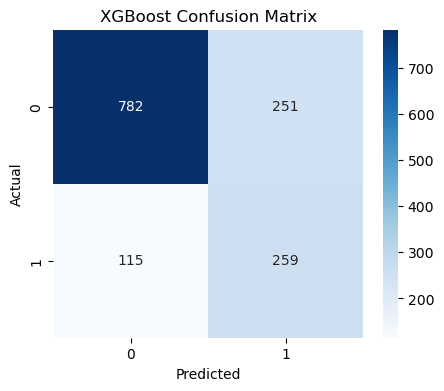
The engine processes 21 customer features—including tenure, contract type, and service usage—to generate risk scores. By prioritizing Recall over simple accuracy, the model identifies nearly 70% of all potential churners, allowing the marketing team to intervene with targeted loyalty offers before the customer cancels their service.
The Challenge
The existing retention process presented several critical challenges that were impacting the company's bottom line:
- High Acquisition Costs: It was costing the company 5x more to acquire a new customer than to retain an existing one.
- Contractual Vulnerability: 70% of churners were on Month-to-Month contracts, but the company lacked a system to flag them for conversion.
- Service Dissatisfaction: Customers with Fiber Optic service were leaving at higher rates, but the cause was not statistically quantified.
- Data Imbalance: Only ~26% of customers churn, making it difficult for standard models to identify them accurately without biased results.

Solution Approach
- Binary Mapping: Mapped categorical variables (Yes/No) to binary (0/1).
- Normalization: Mapped "No Internet/Phone Service" to 0 to maintain feature consistency.
- One-Hot Encoding: Applied One-Hot Encoding to InternetService, Contract, and PaymentMethod.
Technical Deep Dive
The solution utilizes a Gradient Boosted Tree architecture, optimized for imbalanced classification tasks.
              # XGBoost configuration with class-weight balancing


              ratio = y_train.value_counts()[0] / y_train.value_counts()[1]


              xgb_model = XGBClassifier(

                   n_estimators=300,

                   max_depth=5,

                   learning_rate=0.1,

                   scale_pos_weight=ratio, # Critical for handling the 27% churn imbalance

                   eval_metric='logloss'

                   use_label_encoder=False

              )

            # Implementation of the scaling pipeline for Logistic Regression

            scaler = StandardScaler()

            X_train[num_cols] = scaler.fit_transform(X_train[num_cols])

            X_test[num_cols] = scaler.transform(X_test[num_cols])
Results & Business Impact
The predictive engine provides a clear roadmap for retention, shifting the focus from broad discounts to surgical interventions.
(Capturing the majority of at-risk users)
Detailed Impact Analysis
- By identifying 259 "True Positive" churners in a single test batch, the model enables the retention of high-value Fiber Optic customers who contribute significantly to monthly recurring revenue (MRR).
- Replaced manual reporting with an automated risk-scoring pipeline that flags customers for retention teams the moment they enter a "high-risk" behavioral window.
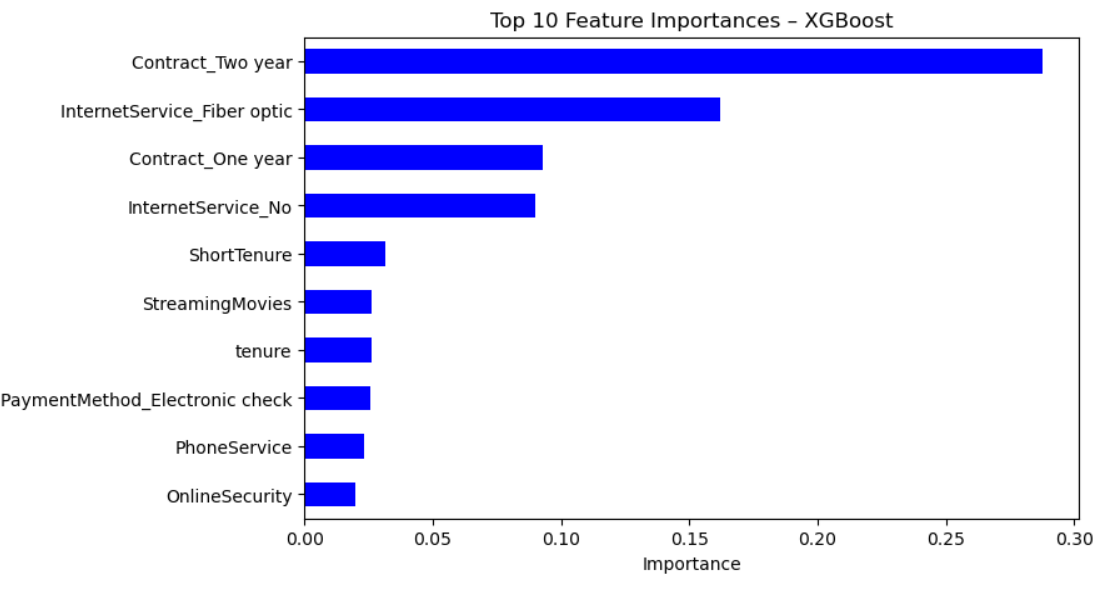
- The analysis revealed that Month-to-Month contracts and short tenure (<12 months) are the highest risk factors, leading to a new strategic initiative to incentivize 1-year contract upgrades.
Key Learnings
This project highlighted the critical role of predictive modeling in proactive customer relationship management. Beyond simple classification, it demonstrated how data-driven decisions can directly impact revenue stability. Here are the key takeaways:
1. Recall > Accuracy for Business Value
In the context of churn, missing a customer who is about to leave (False Negative) is much costlier than sending a discount to a loyal customer (False Positive). XGBoost emerged as the superior choice because it captured more churners through higher recall.
Lesson:Align model evaluation metrics with the specific cost-benefit ratio of the business problem.
2. Contract Structure is Strongest Predictor
The data revealed a stark contrast between contract types. Customers on month-to-month contracts were significantly more likely to churn than those on one- or two-year commitments. This "friction" in the contract serves as a massive buffer against churn.
Lesson: Identify "behavioral anchors" in your data that naturally encourage customer loyalty.
3. The "Value Paradox" of High Charges
Surprisingly, high monthly charges alone weren't the only driver; it was the combination of high charges and short tenure. Customers who hadn't yet realized the full value of the service were the most price-sensitive.
Lesson: The first 12 months of a customer's lifecycle are the most critical for reinforcing value and "stickiness."
4. Explainability Drives Action
Business stakeholders were hesitant to launch expensive retention campaigns based on a "black box" model. Using SHAP values to show that fiber-optic service issues and lack of tech support were driving churn turned the model from a math experiment into a roadmap for service improvement.
Lesson: Stakeholders don't just want to know who will leave; they need to know what to change to make them stay.
Driving Retention Through Data-Driven Insights
This project demonstrates how machine learning can be leveraged to predict customer churn and guide retention strategies. XGBoost effectively identifies at-risk customers, highlighting contract type, tenure, and service quality as primary churn drivers.
Conclusion
This project successfully demonstrates how machine learning shifts customer retention from reactive damage control to proactive revenue protection. By identifying churn drivers like contract type and service quality, the company can proactively secure its most vulnerable revenue streams.
Key Recommendations
- Focus retention campaigns on high-risk customers (month-to-month, short tenure, high charges).
- Promote TechSupport and OnlineSecurity services.
- Improve service quality for high-value segments.
- Monitor campaign outcomes and retrain models quarterly.
Impact
By using predictive analytics to proactively address churn, companies can increase customer loyalty, reduce revenue loss, and optimize marketing investments.